Contact Seller
Contact Seller

Online • Ready to help
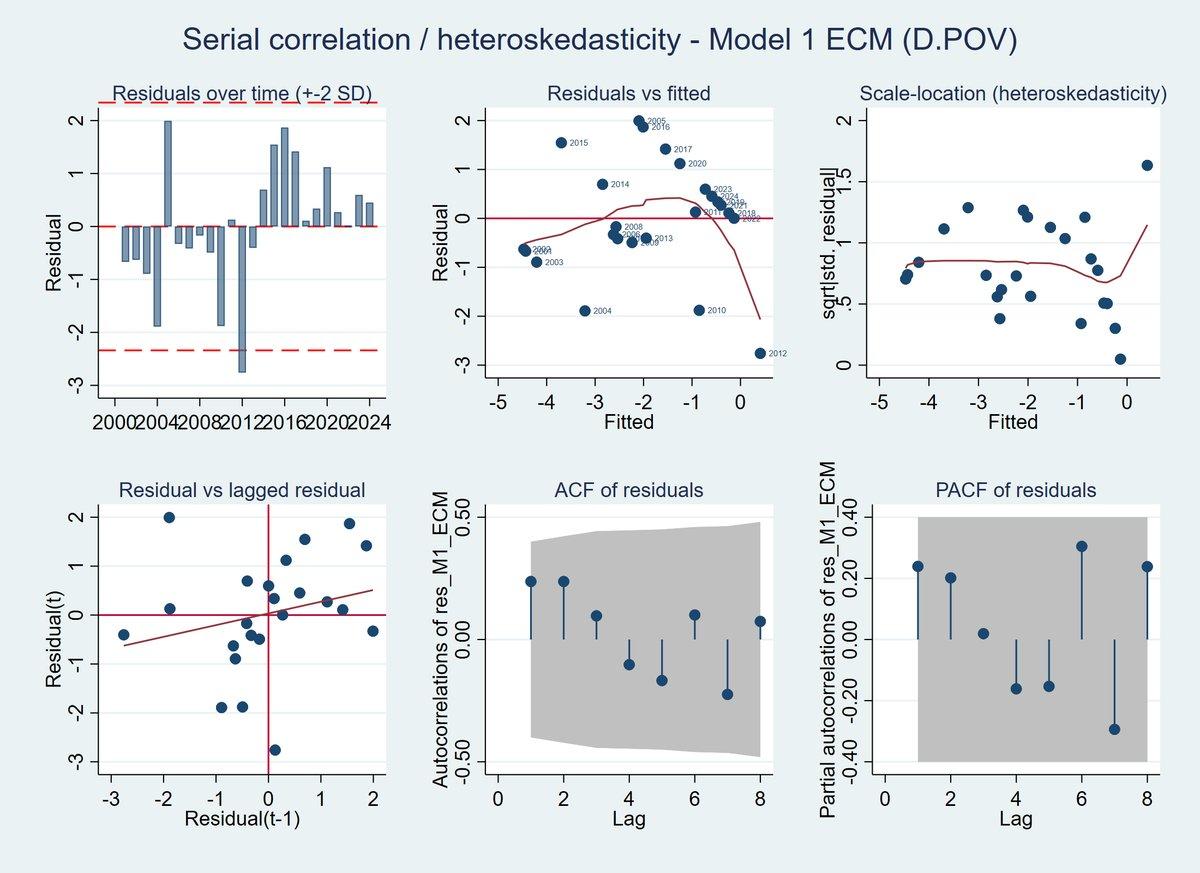
I provide professional data visualization and statistical plotting services using R, Python, SPSS, and Excel. I create publication-quality charts, dashboards, and analytical visuals for research, business, surveys, and academic projects.
My services include heatmaps, correlation matrices, regression plots, scatterplots, boxplots, histograms, bar charts, pie charts, interactive dashboards, and APA-style statistical figures. All visualizations are produced in high resolution (up to 1200 DPI) suitable for theses, dissertations, journal publications, presentations, and reports.
I also offer data cleaning, statistical interpretation, customized designs, and export in multiple formats including PNG, PDF, SVG, and Word. Accurate analysis, fast delivery, and client satisfaction are guaranteed.