Contact Seller
Contact Seller

Online • Ready to help
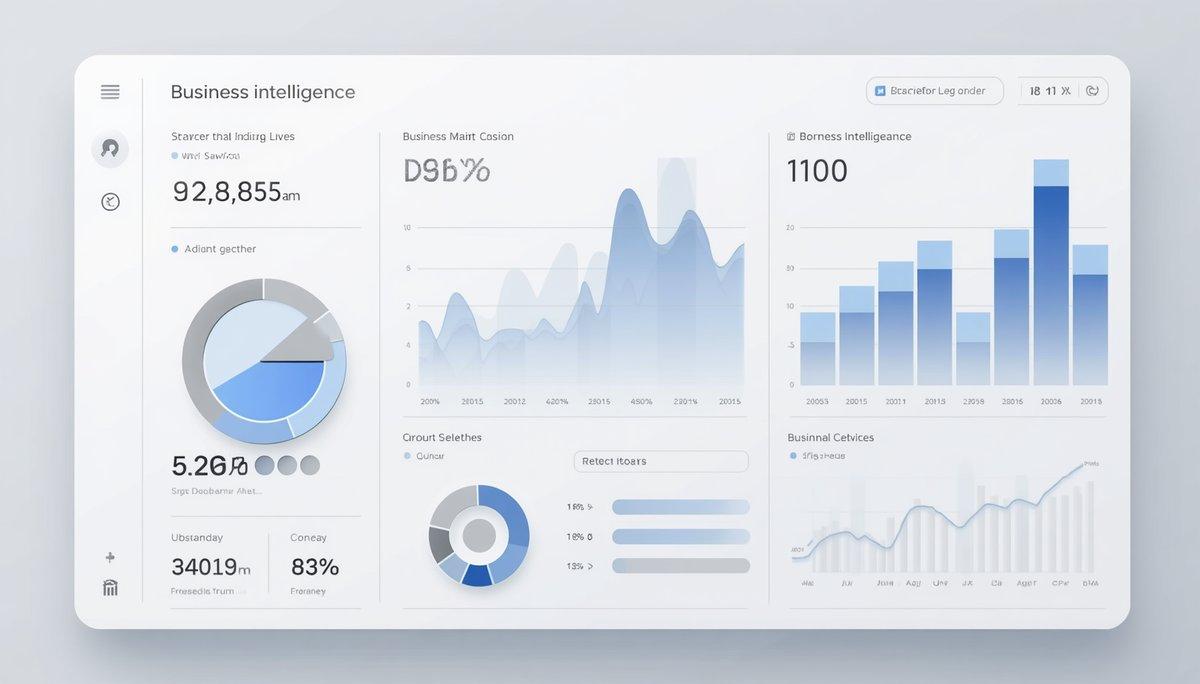
Are you tired of staring at messy rows of data and complicated spreadsheets? Let me turn your raw data into a powerful, interactive visual story!
In today's fast-paced world, making business decisions based on raw data can be overwhelming. I am here to help you transform your messy Excel sheets, CSVs, SQL databases, or web data into stunning, fully automated Data Dashboards that tell you exactly what you need to know at a single glance.
Whether you need to track Sales, Marketing ROI, Financial Metrics, or HR performance, I will design a tailored dashboard that fits your specific business needs.
🛠️ What This Gig Offers:
Data Cleaning & Transformation (ETL): Fixing errors, handling missing values, and organizing your messy data.
Advanced Data Modeling: Connecting multiple data sources seamlessly.
Interactive Visualization: Dynamic charts, graphs, maps, and slicers that update in real-time.
Key Performance Indicators (KPIs): Highlighting the most critical metrics for your business.
User-Friendly Layouts: Executive-ready dashboards designed for easy navigation.
Tool Section
Bricks.co / Bricks App (AI-Powered Modular Dashboards, Dynamic Charts, and Interactive Reports)
Google Sheets / Excel / CSV Integration (Seamless data blending into Bricks)